Soil Sensing Mission continues
In the wake of Project GROW -whose EU funding ran out last autumn- there remains some “afterbirth” in the form of (a) soil sensors in the ground, in the care of (b) ReFarmers determined to continue monitoring the conditions of our soils ongoingly, with or without any outside support.
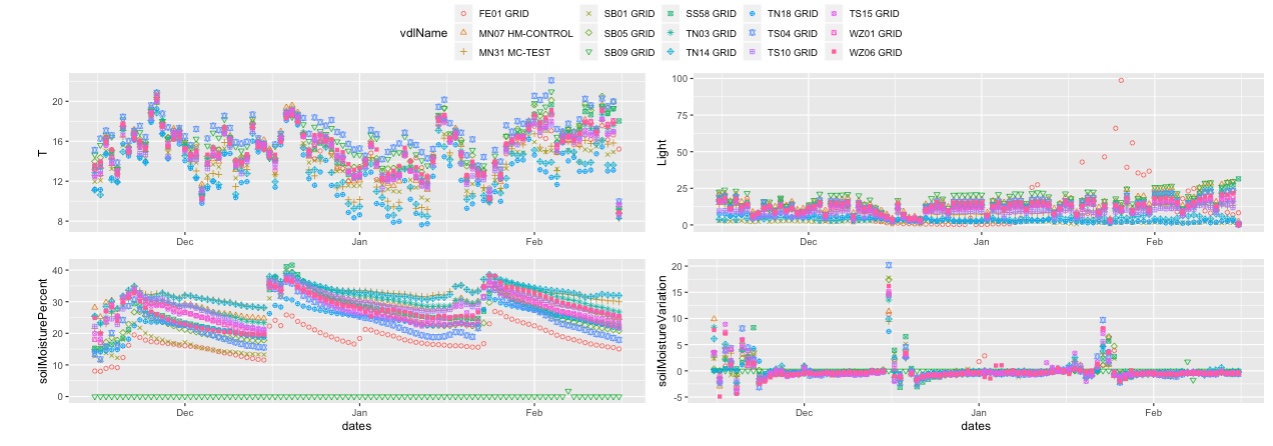
So it is that i have this historical record of Surface Soil Temperature and Light (Top Left and Right, respectively, in these graphs), and Surface Soil Moisture and %change (Bottom Left and Right) for 15 representative sites around my farm, for the period from mid-August 2018 to present (mid-Feb 2020). As you can see from the graph above, Temperature and Light readings track each other pretty directly across the seasons, while Soil Moisture peaks during seasonal lows in temperature and light (i.e. winter), as you would expect.
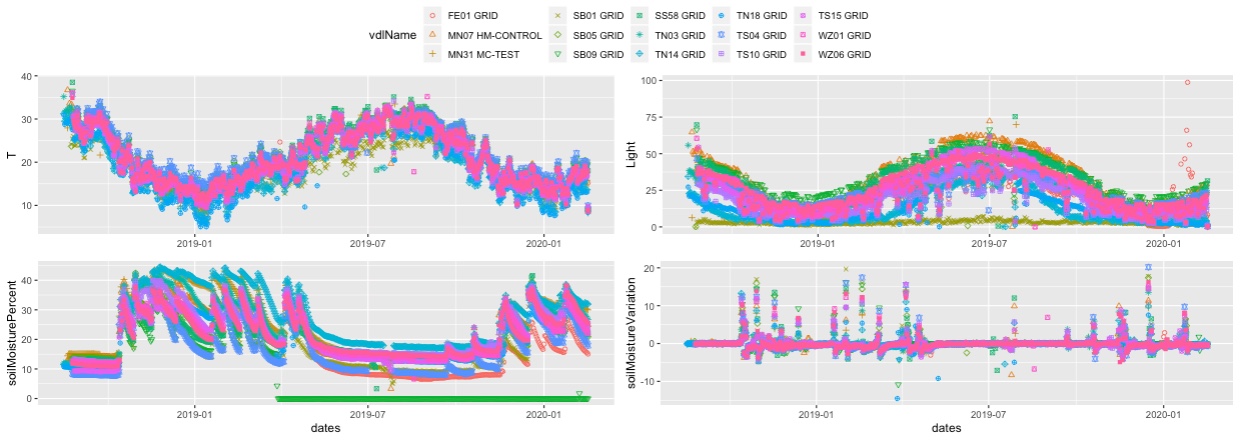
What's more interesting is to compare these two winter seasons, as you can see in the following two graphs, from mid-November thru mid-February, last year vs. this year:
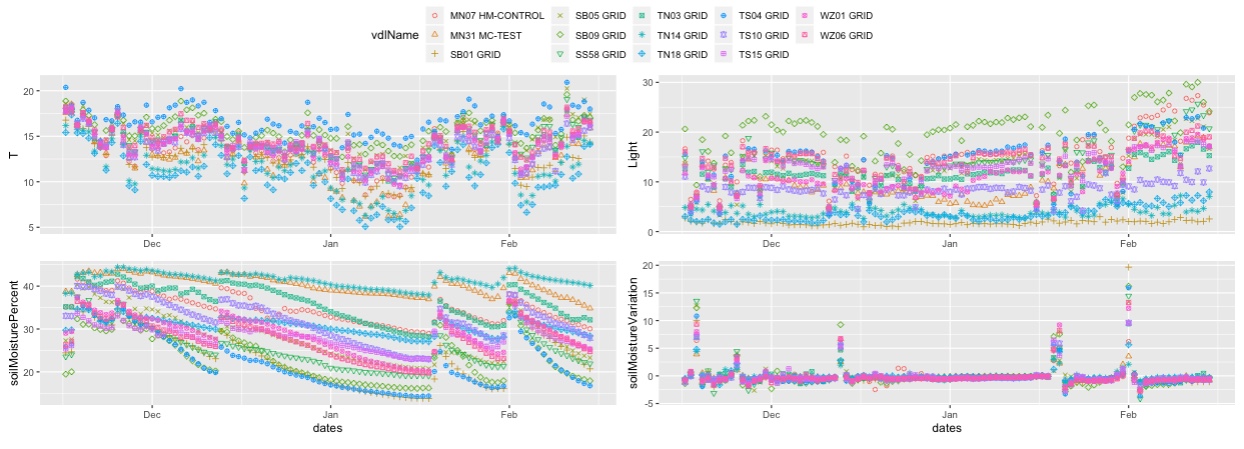 Winter 2018-19 above, winter 2019-20 below